

Do You Have to Let it linger?
Just five songs dominated the Top 10 for over half the year in 2024. Why are hits staying around forever these days?

When Billboard did the math, 2024’s biggest hit was Teddy Swim’s “Lose Control.” Sure, It wasn’t relevant to your teenager like Chappell Roan’s “Good Luck, Babe!.” Nobody was belting it out at ballparks like Shaboozy’s “A Bar Song (Tipsy).
But what it lacked in cultural capital it made up for by simply sticking around.
“Lose Control” spent 48 weeks (and counting) in the Hot 100’s Top 10, more than any other song in chart history other than “Blinding Lights” by The Weeknd, which stayed top 10 for 57 weeks.
Teddy Swims isn’t alone.
During a typical week in 2024, four of the Top 10 slots on the Hot 100 were occupied by an elite group of only five songs:

These five songs remained Top 10 hits for well over half a year.
Just a decade ago, only three songs had ever remained in the Hot 100’s top 10 longer than half a year (26 weeks).

Why are some songs staying on the chart forever these days?
Is it streaming music’s fault?
Is it radio’s fault?
Is it even a problem?
Today, we’ll examine the first part of that question, namely, the role Spotify, Apple Music, and their competitors play in the hits that hang around forever.
Is it Streaming’s Fault?
Yes. (Thanks for reading. Please like and subscribe)
Okay, but why is streaming generating lingering hits?
There’s a logical reason.
From the days of 45s to iTunes, we only tracked when fans bought a song. Once all the fans who wanted to own a song had bought it, sales dried up. (After all, you only needed to buy a song once unless you broke your 45). Even for big hits, sales usually dried up after 16 weeks at the latest. The biggest week for buying a new song was typically the week it was new.
Streaming, however, measures every single time someone plays a song. The charts no longer count how many different people play it. It measures how many times a song gets played—whether a few people play it repeatedly or if a lot of people play it occasionally.
This fundamental change from counting purchases to counting plays has changed the charts in two key ways.
How Streaming Stretches a Song’s Lifespan
First, it has dramatically amplified the impact of an artist’s biggest fans binging new songs when the artist first releases them. The chart below show the percentage of the Hot 100’s Top 10 hits each year based on how long they stayed in the Top 10. Examine the navy blue bars at the bottom—that’s the percentage of songs that stayed in the Top 10 for only one week.
During the SoundScan era of the Hot 100 (when the charts reflected songs folks heard on the radio and—to an increasingly lesser degree—songs people bought on CD or Cassette. Generally, less than 10 percent of songs each year were only in the Top 10 for one week. If you made it there, you stayed there.
The ITunes era made buying singles easy and cheap again, bringing with it a modest increase in those songs that were Top 10 for only one week because fans paid to download them as soon as they dropped. iTunes enabled so many fans of American Idol and Glee to instantly buy songs they heard on the show that they could be #1 for a week, even if radio would never play them.
The streaming era not only made it easy and cheap to sample an unlimited amount of new music, it also started counting each and every time you played that new song. Swifties didn’t just buy “Bad Blood” once: They played “Anti-Hero” 36 times. That change drove up the number of songs that are Top 10 for a week due solely to artist stans’ binge listening. By 2020, almost half of the year’s Top 10 hits were one and done.

Secondly, the change from purchases to plays now—for the first time in chart history—captures those songs listeners keep playing when they’re in control of their music. With streaming, if people like a song, they keep playing it, sometimes for years.
Until streaming, radio was the only measured medium to reflect—indirectly—how long a song remained popular. Knowing some listeners get tired of songs, radio has generally backed off songs after six months at the latest.
With streaming, the chart now cuts out the radio middleman.
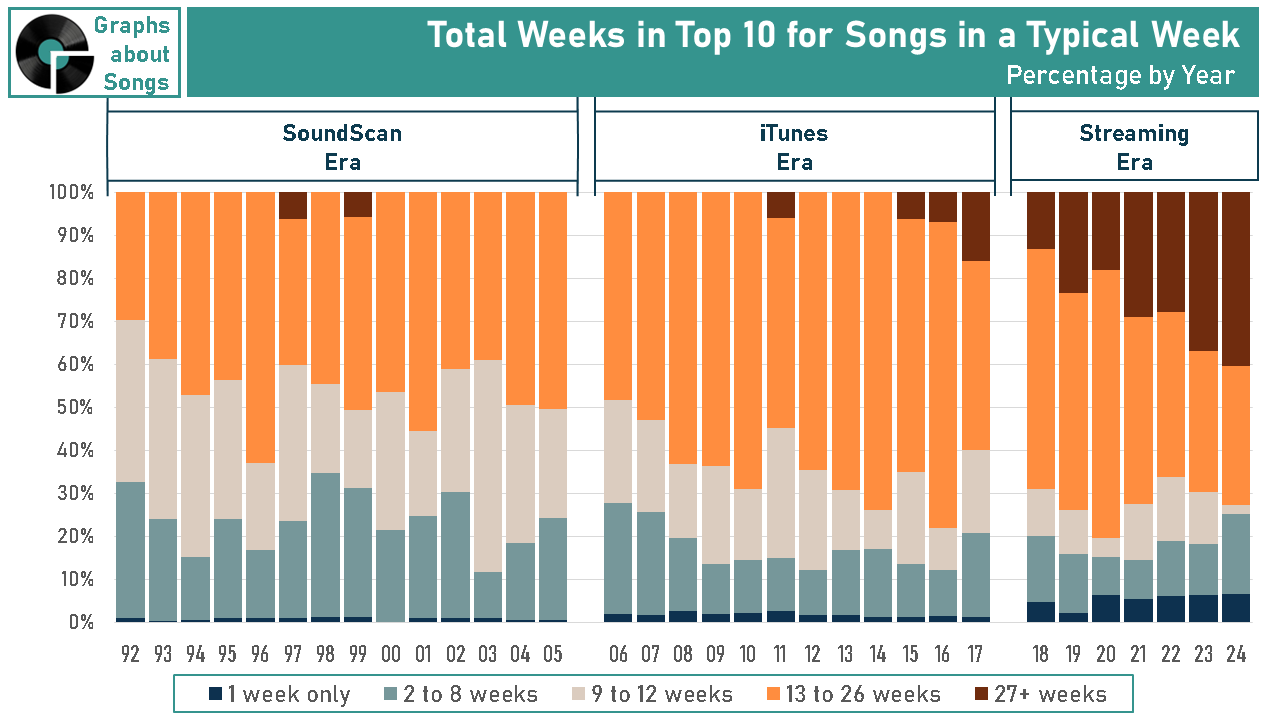
Consider the following graph, which shows how long the typical Top 10 hit in a topical week will ultimately stay in the Top 10. The maroon bars on top show those songs that stayed Top 10 for over half a year.
During the SoundScan and the iTunes era, the only way a song stayed among America’s top 10 songs was if radio kept playing it. Since radio stations don’t want to play songs their listeners are getting tired of hearing, Top 40 stations have historically backed off playing songs once they’re half a year old.
When streaming began impacting the Hot 100 in the mid 2010s, however, those songs that fans kept on streaming for month after month started impacting the charts. By 2024, 40 percent of the Top 10 hits in any given week would stay in the Top 10-for 27+ weeks.
How Teddy Swims Conquered the Chart
Let’s examine exactly how listeners played a few of 2024’s noteworthy songs from week to week on Spotify to see how streaming helps a select few songs take up seemingly permanent residency in the Top 10.
The graphs below show two ways of measuring each song:
The teal line graph shows how many plays the song received from week to week on Spotify in the U.S. It’s the raw data of weekly stream counts. The left axis shows those raw streaming plays per week that correlate to the teal-colored line graph
The color-coded bar graphs show each song’s Momentum IndexSM score. That’s a proprietary measure I developed for The Hit Momentum Report to help professional programmers know which songs are actually mass appeal hits vs. which songs are only big because the artist’s fans are binging it. Instead of just showing how many people played a song this week, it shows if people keep playing the song week after week. Those songs that fans keep playing are typically the songs that become the songs lots of people know and love. The right axis shows the Momentum Index score from 0 to 100 percent that correlates with the color-coded bar graphs.
Refer to this guide when examining the next three graphs.

Example #1: What a normal hit song looks like
“A Bar Song (Tipsy” from Shaboozey is a very typical example of a mass-appeal hit: For its first five weeks, its streaming kept growing as new fans discovered the song. After that, its weekly plays did generally slip form week to week. That’s normal:
An artists biggest fans play those new releases most often when they’re new, then taper off as weeks go by.
Meanwhile, as casual fans discover the song, more of them play it as weeks go by, but they never play it as often as those Artist Stans did when they were binge-listening to it when it dropped.

Up until 26 weeks, “Tipsy” streams dropped consistently with a song that listeners still love—that’s what those green bars for “GREAT” Momentum Index scores over 50% mean.
After 26 weeks, however, “Tipsy’s” weekly plays dropped a bit more form week to week. It’s subtle when looking at the raw number of plays each week on the line graph, but the Momentum Index Score algorithm reveals it. That change is typical for a big hit song that listeners still like, but are starting to get tired of hearing.
Example #2: When a superstar drops a dud
Of course Swifties binged “Fortnight,” along with every other track on The Tortured Poets’ Department. The song featuring Post Malone got over 39 million plays in the U.S. in its first week. But those record-setting play counts didn’t stick.
it (only) got 21 million plays in its second week.
By week six, “Fortnight” garnered less than 25 percent as many plays as it did the week it dropped.

That Spotify streaming pattern means a whole lot of fans were curious about the latest Taylor Swift single, but most didn’t like what they heard enough to keep playing it in subsequent weeks. The light red bars showing the song’s “Poor” Momentum Index scores below 30 percent show a song that listeners are abandoning at a high rate—because they don’t like it.
Example #3: When people never get tired of a song
Let’s get back to Teddy Swims. How did “Lose Control” become the #1 song of the year?
A big part is simply that—unlike most hit songs—its fans seemingly never got tired of it.
“Lose Control” took a really long time for fans to find it. It’s weekly streams slowly grew for over four months as new people started playing it (That’s what the light blue “Still Growing” bars are highlighting.)

Once they found it, they kept playing it. “Lose Control” only peaked at 8 million streams in its 17th week. That’s a big reason “Lose Control” now hold the Hot 100 record for the longest climb of any song (32 weeks) to reach #1.
Almost a year later, however, “Lose Control” is still getting 5.5 million plays each week. That’s outstanding streaming momentum!
To show how significant “Lose Control’s” staying power, is, compare it alongside Taylor Swift’s “Fortnight:”
Even though Fortnight had almost five times as many plays in its peak week as “Lose Control” had in its biggest week, Teddy Swims surpassed Taylor Swift in just 11 weeks.
At 33 weeks, “Fortnight” was no longer even among Spotify’s 200 most-played songs, while “Lose Control” still garners over 5 million plays a week at 62 weeks and counting.

Or consider a better comparison of “Lose Control” to another massive hit: “A Bar Song (Tipsy)” received more Spotify plays in its first 26 weeks than did “Lose Control” in its first half year. At its peak, people played “Tipsy” two and a half times as often as “Lose Control” for its biggest week.
After 26 weeks, however, Shaboozey’s streams fell below Teddy Swims.

“Lose Control” is several months older than “Tipsy”—and therefore has more weeks’ data—-but Shaboozey will likely see its weekly streams continue to decline faster than Teddy Swims’ streams did during comparable weeks.
The Hot 100 Keeps Getting Slower and Slower
Historically, the limit for how long a song can remain Top 10 on the Hot 100 has grown ever longer with every methodological and technological update.

The graph below shows the how long the longest top 10 reign of the year was on average for each of the Hot 100’s four eras:
During the paper reporting era, when radio largely followed song sales and those sales and airplay figures were on the honor system, the longest-lasting song of the year would only be in the Top 10 for three months.
When SoundScan began electronically tracking music purchasing and radio airplay, the typical year’s biggest song typically stayed Top 10 for over four months.
During the iTunes era, the most enduring song of the year typically camped out in the Top 10 for just under half a year. (That’s actually radio’s fault. Stay tuned for that post).

Once Spotify surpassed iTunes and the streaming rra began, the typical song with the longest Top 10 run of the year stayed there for ten months.
That’s a far bigger increase in the length of time the biggest songs spend in the Top 10 in chart history. It also happened in a very short time.
And it happened because streaming—for the first time—-captures the songs fans keep playing for themselves month after month.
Streaming isn’t the only reason songs are sticking around forever.
In a future post, I’ll explore why your favorite local radio station is holding on to the hits longer—and why that’s a problem.
In the meantime, I review the history of how we measure the hits and how it has changed the Billboard Hot 100 throughout the decades in “Does The #1 Song Even Matter Anymore?”.
Want more Graphs About Songs?
Select “NONE” and get Graphs About Songs in your inbox for FREE.
If you program pop music for a a living, selecting a paid “Monthly” or “Annual” subscription also gets you The Hit Momentum Report, my weekly analysis of which songs 83 million American Spotify users say are hits
Data sources for this post:
Spotify Charts (weeks of 1/3/2019 through 1/16/2025 for the USA): https://charts.spotify.com/charts/overview/us
The Billboard Hot 100: https://www.billboard.com/charts/hot-100
Wikipedia’s Billboard Hot 100 Top 10 singles: https://en.wikipedia.org/wiki/List_of_Billboard_Hot_100_top-ten_singles
Billboard Year End Charts - Hot 100 Songs: https://www.billboard.com/charts/year-end/hot-100-songs/