

Why it’s so hard to know what’s really a hit today
This post is a first in a series examining the Billboard Hot 100 from 1958 to 2023 and how time and technology has changed our understanding of hit music.

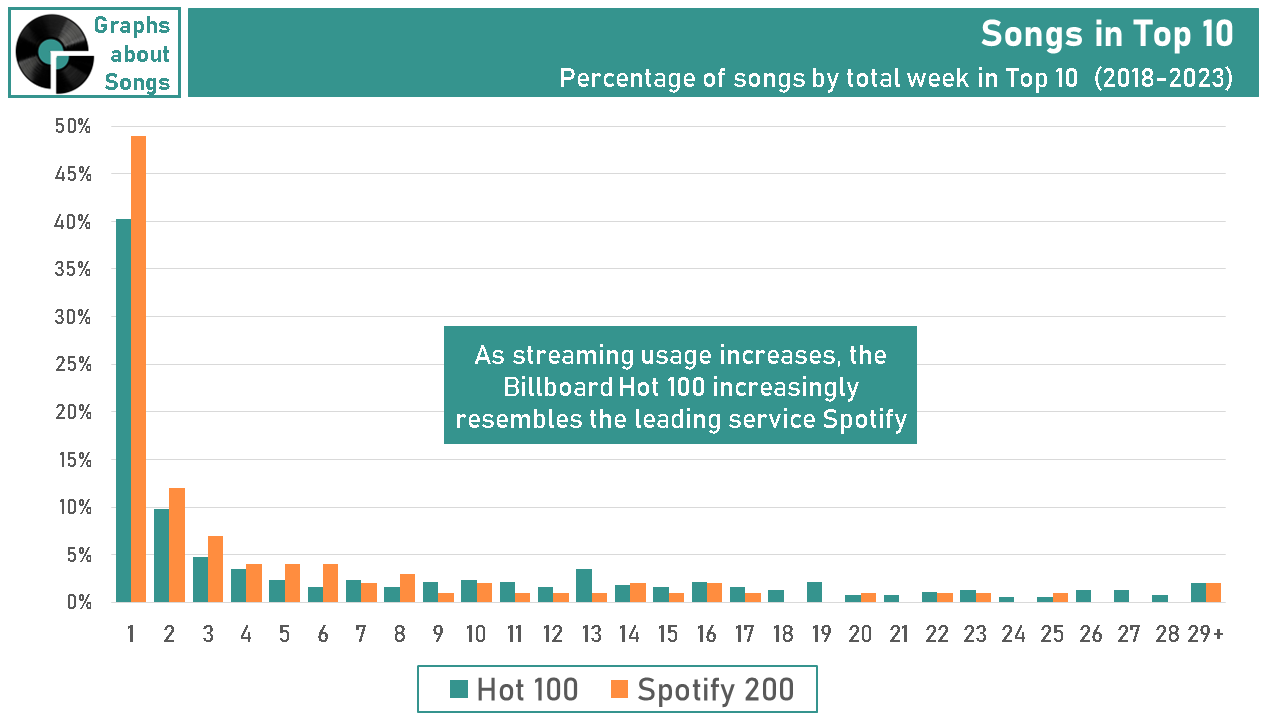
Consider these songs that have spent more time in the Billboard Hot 100’s top 10 than any other songs in the chart’s history:
The Weeknd - "Blinding Lights" (57 weeks)
The Kid Laroi and Justin Bieber - "Stay" (44 weeks)
Dua Lipa featuring DaBaby - "Levitating" (41 weeks)
Morgan Wallen - "Last Night" (40+ weeks)
Harry Styles - "As It Was" (38 weeks)
Notice a pattern? They’re all from the 2020s. In total, 28 songs have lingered in the Hot 100’s top 10 for more than half a year—24 were hits in 2017 or later.
Is this trend damming evidence that today’s music is so bad that even young people are rejecting all but a few new hits?
No. Not at all.
Instead, this trend is the latest—and biggest—of three monumental changes in how we measure music popularity. And while 21st century tech has impacted how we listen to that music, tech’s impact on how we measure music’s appeal is even bigger.
It’s left radio programmers more confused than ever about which songs their listeners really like, despite having more data than ever.
It’s left chart geeks pulling out their hair to make logical comparisons across the years.
It’s left old men yelling at clouds about how music was better in 1967.
To find out how we got here—with “Blinding Lights” a top 10 hit for over a year—let’s journey through the 65-year history of the Billboard Hot 100 to understand how our understanding of the songs we love most has changed.
Since 1958, the Billboard Hot 100 combines the biggest ways Americans consume contemporary music into one chart that Casey Kasem counted down. Historically, that meant tracking which singles people bought most in record stores and which songs radio stations played most. Streaming is also a part of the Hot 100’s equation and it has fundamentally changed how we understand which songs people love.
Keep this graph handy as we go on our journey…

THE PAPER REPORTING ERA: “WE’LL TAKE YOUR WORD FOR IT!”
From Elvis Presley to Paula Abdul, the time that top 10 hits stayed in the top 10 remained remarkably unchanged, typically from one to 12 weeks. Only a handful ever spent more than 12 weeks in the top 10 with the typical hit lasting six weeks.
Also remarkably unchanged during this time was how Billboard determined which songs were most popular. Researchers called record stores and asked for a list of their 30 biggest sellers, then called radio programmers for their playlist of currents. (In the 1980s, the big innovation was reporting those songs by fax.)
Furthermore, Billboard wasn’t gathering actual sales figures or radio spin counts; simply rank lists of the biggest songs from #1 on down.

Right away, you can see some inadequacies.
We’re relying on store clerks’ and radio programmers’ perceptions and memory, not verifiable hard data. If you’re a younger radio professional, you might wonder if you could enhance your promotions resources by “adding” the right songs. Veteran radio programmers will confirm your hunches.
The biggest shortcoming of this methodology, however, was the use of ranking lists instead of raw data.
THE SOUNDSCAN ERA: “THEY STILL LOVE THAT OLD SONG?”
On November 30th, 1991, Billboard implemented two changes that changed the charts overnight:
They begin tracking sales using SoundScan. Every time a store clerk scans the UPC bar code on a record purchase at a participating retailer, info on that purchase goes directly to SoundScan.
Simultaneously, Billboard replaced those calls (and faxes) to radio PDs with Broadcast Data Systems (BDS). Just as Mediabase does today, BDS (R.I.P.) monitored radio stations around the clock, tracking every song they played using each song’s unique sonic identifier. Then, BDS cross-referenced those spins against ratings data to calculate how many times radio listeners heard that song.
With electronic tracking of sales and spins, song popularity was no longer subject to store clerks or music directors having accurate memories. It also limited (but did not eliminate) ways labels could manipulate data.
Even more important statistically was the switch to actual raw sales data and radio audience impressions instead of the far fuzzier method of comparing rank lists.
SoundScan’s implementation instantly—and famously—spotlighted that Hip Hop, Country, Alternative, and Metal were more popular than previously believed. (Stay tuned for a future post about genre changes.)
For individual songs, SoundScan and BDS also instantly revealed that some songs remained popular for many weeks longer than previously thought. Overnight, 25% of the Top 10 songs on the Billboard Hot 100 remained Top 10 for 13 to 26 weeks. The average weeks songs spent in the Top 10 also jumped from six to nine weeks.
For radio, that wasn’t a new discovery.

CALLOUT RESEARCH: “I STILL LOVE THAT SONG!”
Throughout the 1960s, radio stations based their airplay on which songs people were buying. So while the top 10 reflected both sales and radio airplay, that airplay would dry up as soon as people stopped buying the record.
In the mid 1970s, however, some pioneering radio stations began using callout research. They would randomly call people on their home phones, play them snippets of popular tunes, and ask if they knew it and liked it. Callout quickly revealed that listeners still love those big hits long after sales of the record had slowed.
It shouldn’t have shocked anyone. Just because new people stop buying a record doesn’t mean people who bought the record stopped playing it. Suddenly, radio created a new category of songs called “recurrents” comprised of songs that were no longer new, but that listeners still loved to hear on the radio.
By the 1990s, callout was firmly entrenched as radio’s primary resource for determining current rotations. However, Billboard’s charts obscured callout’s impact on actual airplay until those faxed-in ranked playlists gave way to real-world spin counts.
The impact of months-old recurrents was so dramatic, Billboard started artificially forcing songs off the chart with the 1991 switch to SoundScan.
THE WAR ON SINGLES: “I’LL JUST HEAR IT ON THE RADIO”
Concurrent with SoundScan and BDS, an early 1990s consumer tech trend also gave record labels a way to finally kill a format they despised: the single. Why settle for a couple of bucks for a 45’ or a Cassingle when you could force folks to spend $16.98 on the whole CD to hear No Doubt’s “Don’t Speak”? (That’s $33.95 in 2024 dollars).
Because Billboard balances the Hot 100 between single song sales and radio exposure, fewer singles’ sales meant radio airplay received more weight. More than any other time in history, the 1990s’ Top 10s reflected the passive fandom measured in radio’s callout research.
In 1998, Billboard dumped the rule that a song had to be for sale as a single to qualify for the Hot 100. However, new technology would soon bring back the single, even if the labels had to be brought to their knees to embrace it.
THE ITUNES ERA: “I WANT THAT SONG RIGHT NOW!”
On May 19, 2009, almost 10 million Americans tuned in to Fox for a new show about a fictional high school in Lima, Ohio and their archetypal misfits who loved to sing. Glee became one of the most successful TV shows of the 2010s. Glee also spotlighted a new phenomenon in popular music—the one and done hit.
In its premiere episode, Glee’s underdog show choir New Directions performed a rousing rendition of Journey’s “Don’t Stop Believin’.” So many were moved by Glee’s version, they went straight to their laptops, opened Apple’s iTunes, and paid 99-cents to download it on the spot. The song sold 177 thousand copies during the week following Glee’s debut, enough to push “Don’t Stop Believin’” to #4 on the Hot 100.
After that week, however, the song vanished from the top 10.
Had Glee been a 1995 phenomenon, fans would have had to drive to the mall and pay $16.98 for a Glee CD. Sure, some fans would’ve, but even instant converts couldn’t buy it right after the show. Musicland closed at 9:00.
Had Glee been a 2000 phenomenon, some fans would open a new program called Napster and—ehem—borrowed an mp3 copy from a friend.
But in 2003, Steve Jobs solved the music industry’s “borrowing” problem with the iTunes Store. For the first time, music consumers could easily and legally buy popular songs as individual digital tracks for only 99 cents. Two years later (2005), Billboard would add those paid digital downloads to the Hot 100 chart data.
Enter the one-and-dones.

Typically, about seven percent of songs had been in the top 10 for only one week, almost all of which briefly scratched the top 10’s lower rungs. By 2008, however, as digital downloads became the dominant way people bought new music, the percentage of songs that were Top 10 hits for only one week jumped to 21 percent. Several soared to #3 and #2 in their sole week in the Top 10.
American Idol and its contestants were big to capitalize on this new way to buy music impulsively to be a part of—dare I say it—a moment like this. However, interest in these songs evaporated as quickly as it erupted. TV shows are culturally relevant for days, not months. I’d bet David Archuleta’s “Crush” isn’t on your local radio station. (It was a #2 hit in 2008, but only top 10 for one week.)
More importantly, buying individual songs quickly and cheaply helped artists with narrow but wildly passionate fan bases score top 10 hits overnight. Fans of Pre-teen stars like One Direction, Selena Gomez, the Jonas Brothers, and (erstwhile Adult Contemporary hitmaker) Miley Cyrus would download those artists’ latest singles as soon as they dropped. Without the wider audiences of less passionate fans that typically drive radio exposure, however, demand for these new releases was largely saturated from that initial blast of sales. There simply weren’t new fans discovering these one-and-dones.
Similarly, Hip Hop artists including Kanye West, Lil’ Wayne, and Drake also benefited from fans buying their latest singles as soon as they dropped, even though those sales didn’t generate lasting hits.
Particularly with Hip Hop, the rise of the one-and-done hits during the iTunes era was a harbinger of a far bigger change streaming would bring.
STREAMING CHANGES EVERYTHING—FROM ONE AND DONES TO MEGAHITS
Remember AOL Radio? It was essentially a collection of automated online radio stations. It was the first streaming service whose data Billboard added to the Hot 100 in 2007.
It also was what we thought was the future.
Back then, streaming meant internet radio. Pandora, with its then-groundbreaking ability to create a radio station just for you, was broadcasters’ biggest worry. We assumed streaming would replace your FM radio, but that we’d all still buy songs on iTunes.
The future ain’t what we thought.
In 2011, Spotify introduced the U.S. to the ability to stream any song you want, giving consumers an entire record store in their pockets. Billboard incorporated that data—along with YouTube music video views—in 2013.
Apple Music famously launched as a Spotify clone in 2015 (ironically with an honest-to-goodness radio station in Beats 1, complete with terrestrial radio legends Zane Lowe from BBC Radio 1 and Hot 97’s Ebro Darden as hosts).
Pandora, now in decline, pivoted to be yet another Spotify clone.
With Billboard weighting streaming alongside plummeting sales and slowly slipping radio usage, the Hot 100 started predominantly reflecting streaming consumption in 2018.
Immediately two things change:

1) The percentage of songs that were only in the Top 10 for one week jumps from 17% during the iTunes era to 40% during the streaming era.
When a Swiftie bought “We Are Never Ever Getting Back Together” in 2012 (Taylor wouldn’t let them stream it), their fandom counted as one purchase. When that same Swiftie binged Midnights a dozen times when it dropped in 2022, their fandom counted as 12 streaming plays for each track.
This seemingly semantic change is critical to understanding today’s music metrics.
Because streaming metrics track how many times a song plays, not how many different people play them, it amplifies the impact of an artist’s fans sampling a new release compared to the song sales metric it has replaced.
However, the novelty of the new ultimately wears off quickly even for an artist’s most ardent fans. Folks add the new songs they love to playlists with other favorites, or simply listen to the latest album less frequently.
For a song to continue receiving chart-topping streaming plays after the new-release binging dies down, it has to become popular with a much wider audience of listeners who like the song, but aren’t artist stans.
Which brings us to the other major change.
2) A new crop of megahits emerged that stay in the Top 10 for well over 26 weeks.
Radio’s passive fans are often most into a new song right at the 12-week mark where active fans have stopped buying or binging that song. However, radio programmers are also keenly mindful of the moment when their listeners are getting tired of a song. Even if their callout research says listeners still love a song months after its release, radio programmers don’t want their listeners thinking they’re the stale, out of touch station that’s always playing last year’s music.
Therefore, stations have typically backed off playing even the biggest hits after 26 weeks—whether because their research said some listeners were getting tired of hearing it, or if their gut said it was time to move on.
From the 1991 implementation of BDS airplay until the end of the iTunes era in 2017, songs rarely charted longer than 26 weeks because radio stations were generally unwilling to keep playing songs any older than half a year in their heaviest rotations.
In 2018, however, streaming ended radio’s monopoly on determining how long hits remained hits.
Unlike song sales, which only reflect the active fandom of consumers who love a song enough to buy it, streaming data also reflect those passive fans who hear a song on the radio and add it to a playlist, or play the song on a playlist someone else put together, or who simply let Spotify pick the next song.
Once Spotify users decided they liked Morgan Wallen’s “Last Night,” or “As It Was” by Harry Styles, why would they suddenly stop playing it arbitrarily when it’s half a year old?
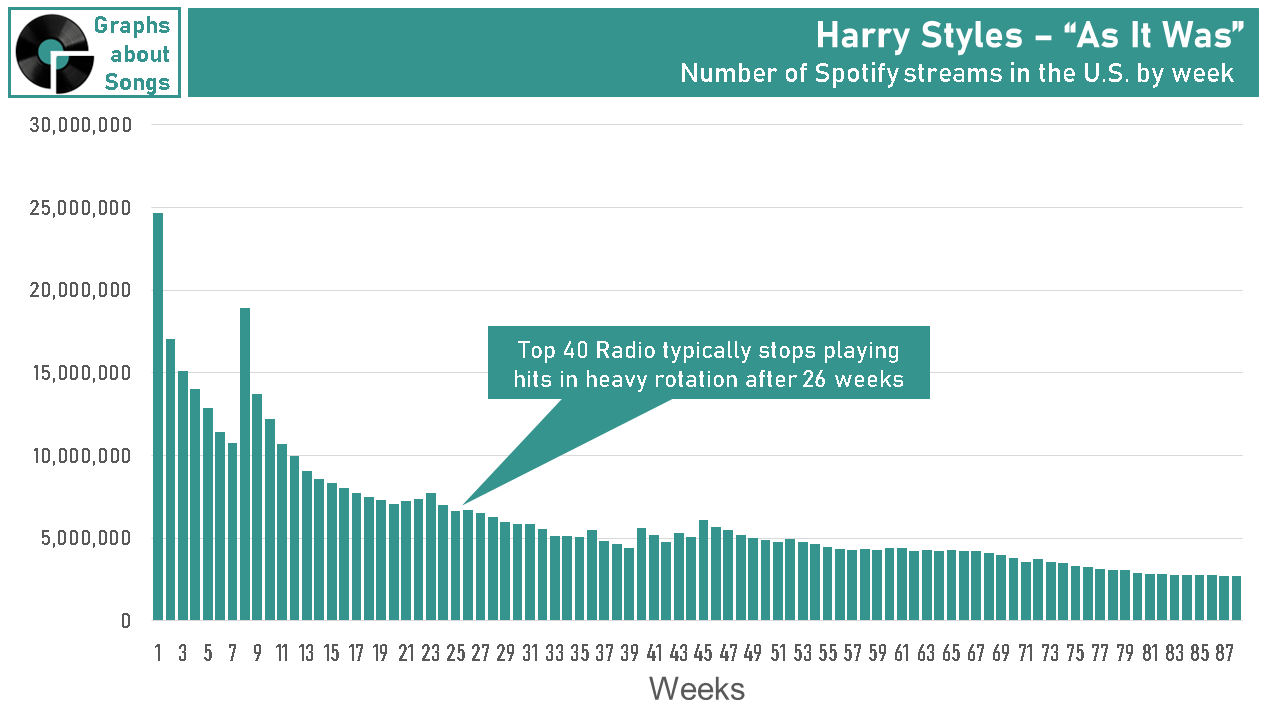
That’s why these megahits that remain among America’s Top 10 most-heard songs for longer than 33 weeks are all from 2018 through today. It wasn’t until 2018 that consumers themselves—not radio programmers—were in charge of how long they wanted to keep hearing the hits.
That word “hit” is important here. To become a long-lasting megahit, a song must become popular among a wide, mass appeal audience. An artist’s core fans aren’t a large enough voting block to keep a song among America’s most streamed songs week after week… even the Swifties.
HAVE THINGS REALLY CHANGED THAT MUCH?
In 1967, The Beatles’ Sgt. Pepper’s Lonely Hearts Club Band was the U.S.’s bestselling album for 15 weeks. It ushered in the era of the album as a congruent musical work and Album Rock as an emergent FM radio format.
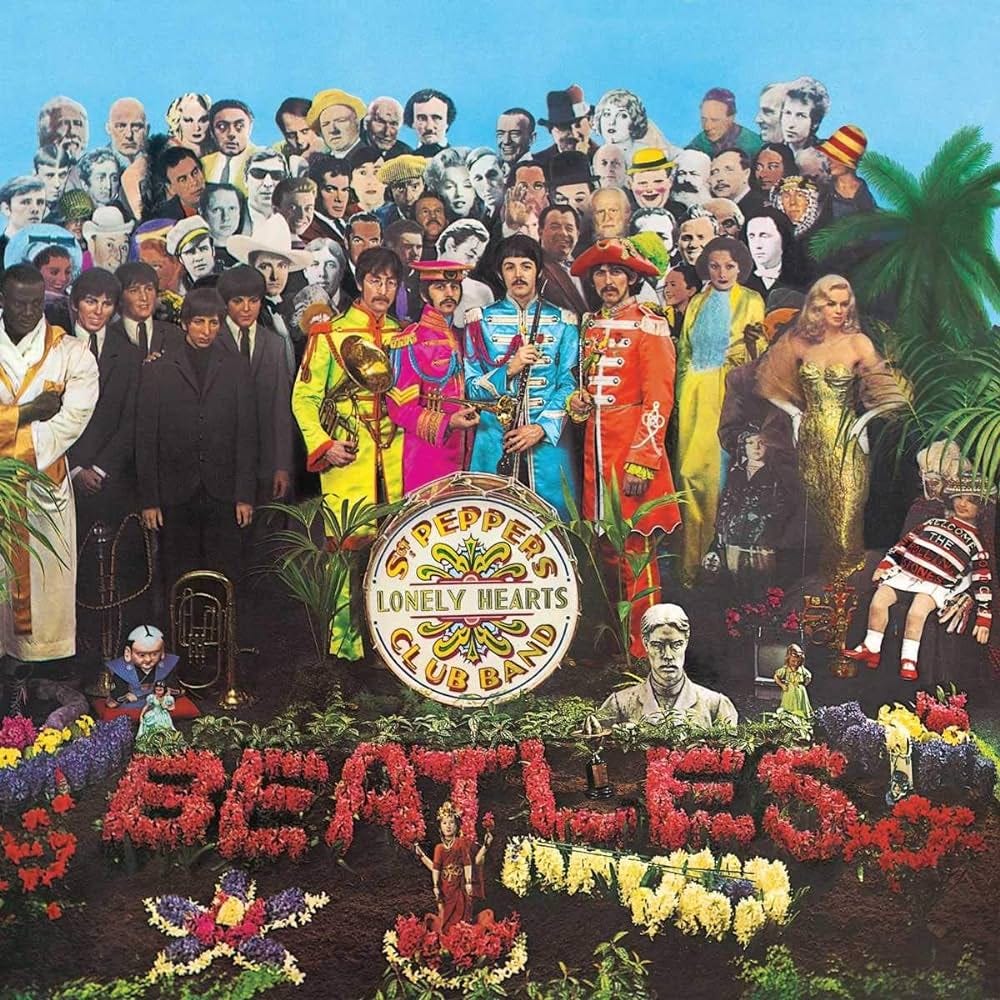
Since none of those songs were ever 45s, none charted on the Hot 100.
If we could have magically monitored the record players of 1967’s youth and reported each time someone played a specific song, we may well have seen the Beatles fill the top 10 with Sgt. Pepper’s tracks just as Taylor Swift did with Midnights 55 years later.
After all, Johnny Rivers did report that, “All Summer Long, […] everybody kept on playing Sgt. Pepper’s Lonely Hearts Club Band.”
At the same time, our ignorance also fueled an era of music with a bounty of beloved classics, where another legendary song was waiting in the wings when a song had finished its 12-week run on Top 40 radio.
We’ll examine that question of whether or not there are fewer mass appeal hits today than there used to be in our next post in this series.
Sources for this post:
The Billboard Hot 100: https://www.billboard.com/charts/hot-100
Wikipedia’s Billboard Hot 100 Top 10 singles: https://en.wikipedia.org/wiki/List_of_Billboard_Hot_100_top-ten_singles
Spotify Charts: https://charts.spotify.com/charts/overview/global
Other resources for this topic:
Slate’s “Hit Parade” Podcast with Chris Molanphy: The Great War Against the Single Edition: https://www.slate.com/articles/podcasts/hit_parade/2017/09/the_story_of_how_the_recording_industry_made_you_pay_a_premium_for_90s_hit.html
Fascinated as always Matt! An excellent thorough review of the different forms of data used to compile the Billboard Hot 100 through the years. Has Billboard found a way to eliminate the chart bias created by allowing one user to count for 50 streams a day 350 a week? Seems like a paltry figure unless you consider that a fan army of 10,000 people listening on steroids could count for 3.5 million streams and could greatly influence that songs chart life that week.
I'm just a music fan…I’ve purchased 1,000’s of 45’s, CD singles, iTunes singles and cassingles. Yes, I’ve purchased multiple copies of some in my younger years hoping to influence Billboard. (I miss Tower Records…). I’ve considered cancelling my 40 plus year Billboard subscription because of the latest methodology...and besides, my garage is getting full of them. For example, I buy an iTunes song for $1.29 and play it a hundred times...did my purchase influence the chart as much as if I would've played the song 100 times on YouTube? This is where I get confused with their weighting process... Anyway, I am one of those that is curious when Billboard publishes an "all time rankings" chart and ranks songs from multiple decades. Fun to read...but skeptical on the adjustments/ranking. Personally, songs stay on my iTunes playlist (I don't stream) for about 10-15 weeks. Anyway, great article...informative and fun! I can do a better job now explaining to my friends. (People notice how a new album can take the entire top 10 on a particular week.) I really appreciate your analysis and detailed examples. (New to Substack...you brought me here!)